Reading the charts shouldn’t be a difficult thing to do, but it’s confusing at the beginning, so people may have some problems doing that until they get used to the concept and understand the different colors, shapes, lines, and numbers. When it comes to crypto trading and investment, it’s always a good idea to have these charts with you, especially if you are a newbie in this business. They will help you learn more about the price changes over time, but also you can extract important data following the needed criteria.
If you have serious intentions to get into this market, you have to know some basic things and how to compare them. For example, you can find which cryptocurrency is the most expensive right now or which ones are the best to invest, on erecoin.io, but also you need more than that to be successful in your actions.
Knowing that a lot of people are investing in cryptocurrencies without previous experience in stock or Forex trading, the charts can be confusing, but once you get them, you can get to know a lot of important things by just paying a look at them. You need to understand the peaks, drops, profits flow, and other important data metrics, so you can know what you are doing all the time.
You also have to know that there are different types of charts, and they aren’t the same, so you need a different approach to understand them. But in general, the line you see over the chart shows how the value is changing through time, following different criteria.
What contains one crypto chart?
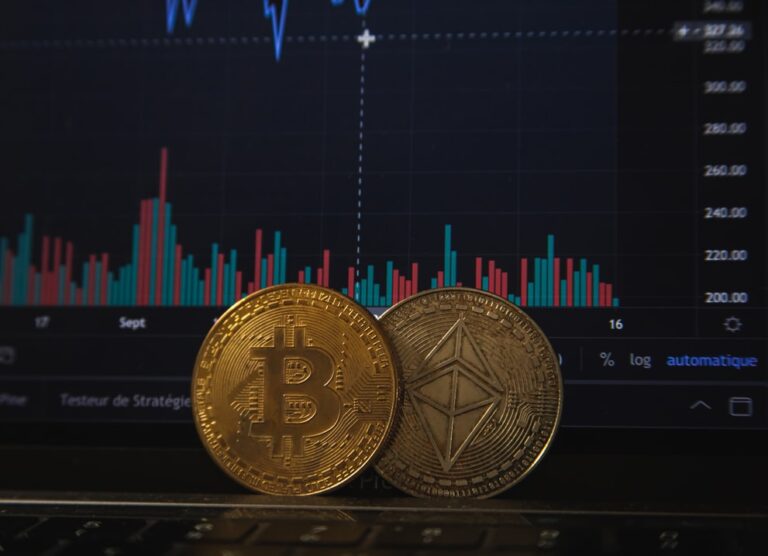
The charts are a graphic display of the prices, trading volume, interest, peaks, and drops, and other data that is relevant for it.
They can show how the price was changing in a particular period, which dates are most important right now, how the others cryptocurrencies compare to Bitcoin, the 24-hour interest, and many others criteria.
In order to read them properly, you need to understand the basic elements of crypto charts, like time frames, candlesticks, line charts, trading volume, and so on. So, let’s see how it goes:
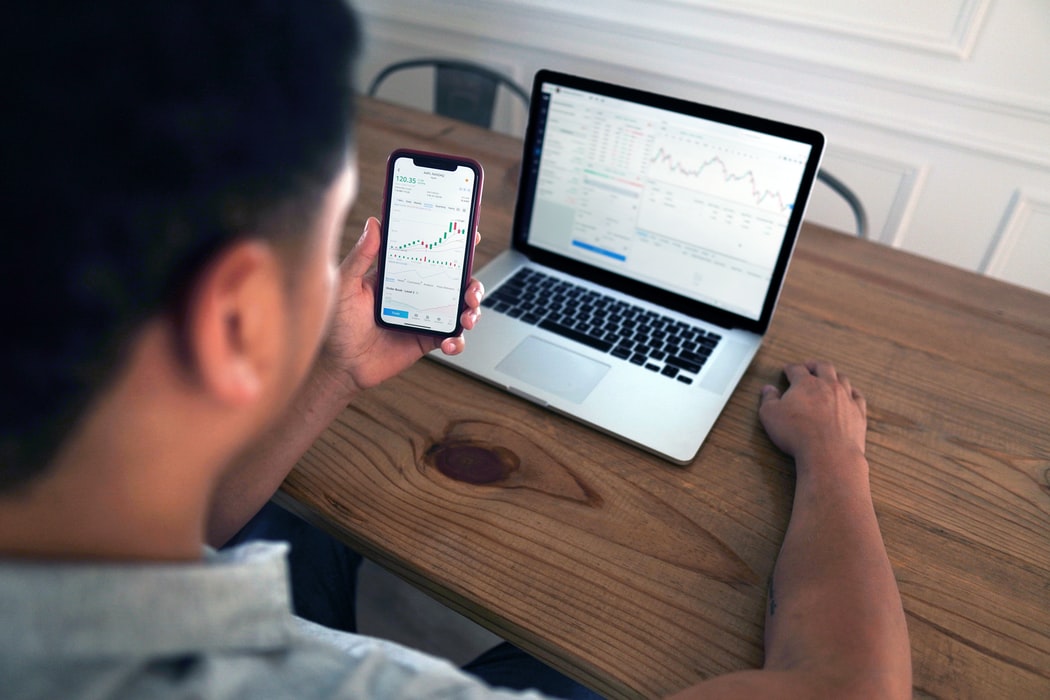
Time Frame
You are choosing a time frame to see how things were going during that particular period. For example, you can choose to see a chart for the last hour, the previous week, for few days, a whole month, or a 12-month period. You can see a chart that depends only on the price changes through time that is relevant to you. This is a nice beginning to your crypto journey.
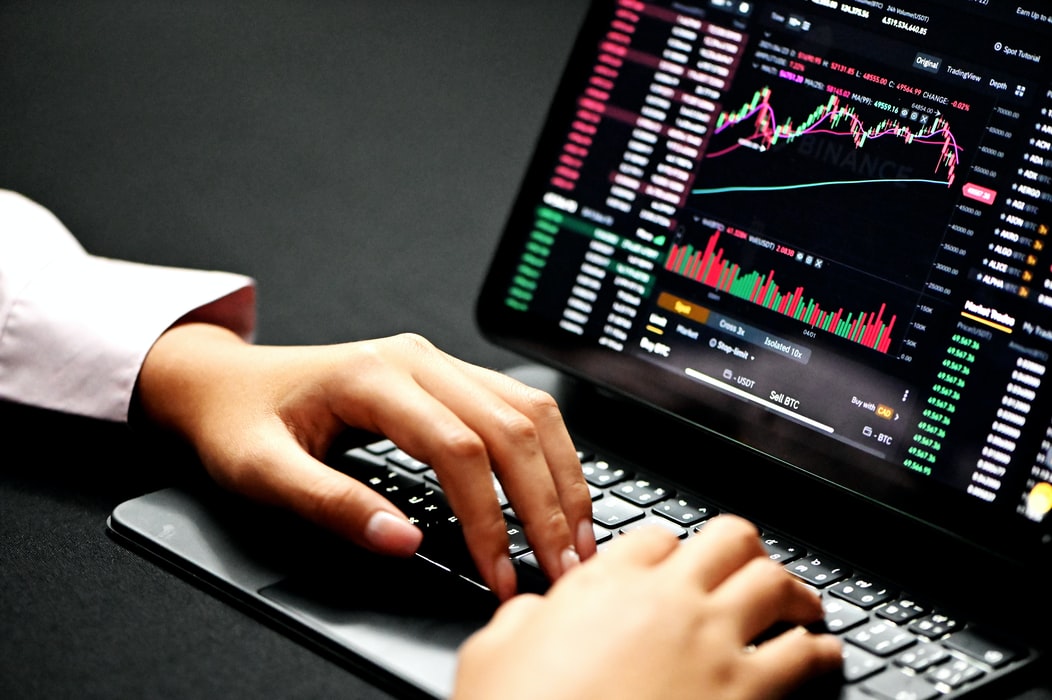
Candlesticks
You are tracking the price activity, by if it’s open, close, high, or low. The candlesticks are turning green or red, depending on if the price is going up, and the closing is higher or lower than the opening price. This is a nice chart for those who already have some experience in trading, and know what all these data mean.
Trend Identification (Trend Lines)
You need this one to analyze the whole trading process and detect the current situation in the entire market. This will help you follow the trends, but also detect the factors that can change the situation. You can split the chart into smaller sequences, and analyze them, so you can see the bigger picture, realize how things are going, and take proper actions.
Line charts
These are the ordinary charts that depend only on two values. You can turn any other chart into line one, so you can be more systematic and detailed in your reading. The progression and drops are showing with one line, which depends on the time, and you can change the criteria, so you can create a strategy that will bring some profits to you.
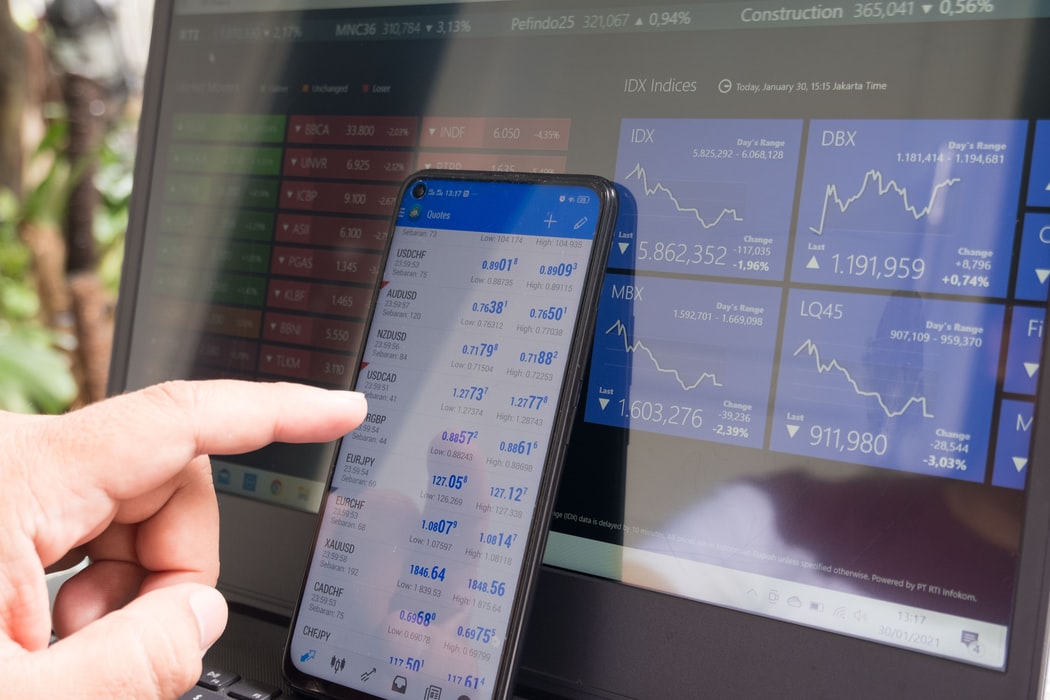
Trading Volume
This is a term that is used in stock trading and exchanges too, and it shows the price at some particular moment or pre-defined period. When it comes to cryptocurrencies, this can be a useful thing to know, since you can see if the other people are trading right now, and then monitor the other values, and make decisions based on them. This unit will help you determine if it’s worth trading right now, or you should wait at least a few hours to take an action.
Understand the terms Bullish and Bearish
You will meet these two terms pretty often. When an experienced investor believes that the particular value will grow through time, it’s known as Bullish. But, if they initiate a belief that there will be drops, it’s known as Bearish. These aren’t many relevant units, but it’s worth paying attention to them too.
You can create your own charts too
If you are skilled enough to do that, and you know how to generate charts and infographics, you can indeed do that, so you can help yourself detect your previous mistakes and prevent some unfortunate events related to them. Also, they may be useful for your friends who will join the crypto market after you.
The crypto market is complicated and volatile, and it’s pretty difficult to follow rules, so you can make decisions and take planned steps.
Use all the knowledge and sources you have, including the charts, to predict the changes through time, and get most of it. Choose one coin to observe, and compare the other values to it. Try not to overdo it, since you can easily get confused, especially if you are a beginner.
Sometimes, even though it seems like there are patterns, you need to see things clearly, so you can be sure it’s worth taking that risk. The charts are giving you a nice insight into what’s happening on the market, and you can use them to make predictions and plan your actions.
Once you learn how to read the charts like a pro, you will take crypto actions as a pro too. You only need to observe the changes and detect the right time to take an action.